Multi-Timeframe Trend IndicatorMulti-Timeframe Trend Indicator
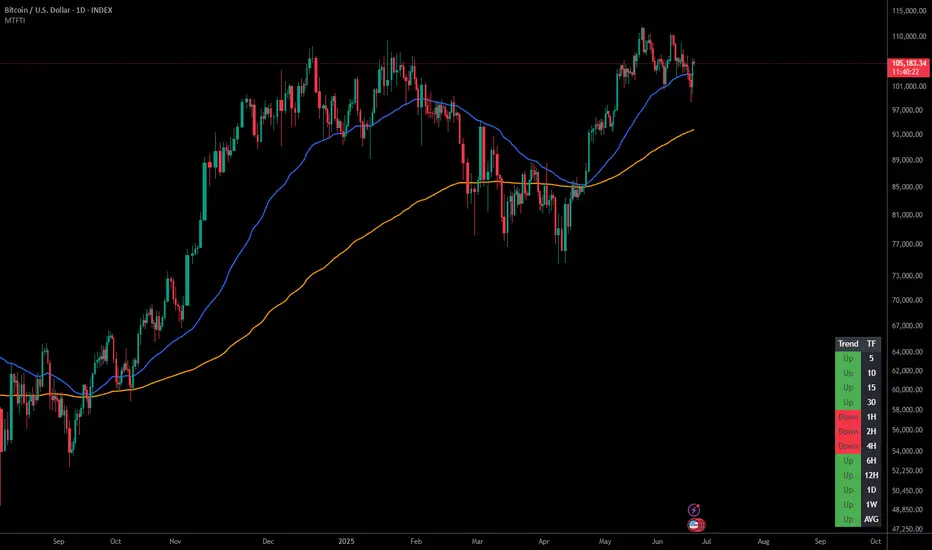
The “Multi-Timeframe Trend Indicator” is a versatile tool designed to help traders identify trends across multiple timeframes using Exponential Moving Averages (EMAs). This indicator is suitable for both novice and experienced traders. It allows users to customize the lengths of the short and long EMAs, providing a clear visualization of the trend direction (UP, DOWN, SIDE) for various intervals including 1 minute, 5 minutes, 15 minutes, 30 minutes, 1 hour, and 4 hours. The indicator offers extensive customization options, enabling adjustments for table position, colors, and more to suit individual trading preferences.
How the Calculation Works
The Multi-Timeframe Trend Indicator uses EMAs to calculate trends. EMAs give more weight to recent prices, making them responsive to new information. The short EMA, calculated over a shorter period, reacts quickly to price changes, while the long EMA, calculated over a longer period, smooths out fluctuations to show the overall trend.
For each timeframe, the indicator calculates both the short EMA and the long EMA. If the short EMA is above the long EMA, the trend is considered “UP”. If the short EMA is below the long EMA, the trend is “DOWN”. If the absolute difference between the short and long EMAs is within a user-defined threshold, the trend is classified as “SIDE” (sideways).
This calculation is repeated for multiple timeframes: 1 minute, 5 minutes, 15 minutes, 30 minutes, 1 hour, and 4 hours. The results are displayed in a table, providing a comprehensive view of the trend direction across different timeframes.
How the Code Works
Input Parameters: Users can input the lengths of the short and long EMAs and the threshold for identifying sideways trends. These inputs allow for a high degree of customization to match individual trading strategies.
Trend Calculation Function: The trend function calculates the trend direction based on the EMAs. It uses the math.abs function to find the absolute difference between the EMAs and determines if the trend is “UP”, “DOWN”, or “SIDE” based on the threshold.
Requesting Data for Multiple Timeframes: The script uses the request.security function to fetch price data and calculate the EMAs for different timeframes independently of the current chart timeframe. This ensures consistency in trend analysis regardless of the displayed timeframe.
Creating and Updating the Table: A table is created to display the trend directions for each timeframe. The table’s position and appearance can be customized. The trend data for each timeframe is color-coded (green for UP, red for DOWN, gray for SIDE) and displayed in the table.
Customization Options: Users can customize the colors, table position, and EMA lengths through the indicator settings, providing flexibility to adapt the indicator to their trading style.
Disclaimer
This indicator is for informational purposes only and should not be considered financial advice. It does not predict future price movements and does not guarantee accurate trend calculations, as market conditions can vary. Trading involves substantial risk and is not suitable for everyone. Always conduct your own research before making any trading decisions.
Pine Script®指標